
Several trends were revealed in the analysis of crashes that occurred on regional roadway network from the years 2021 to 2023. An overview and detailed report are below.
Documents
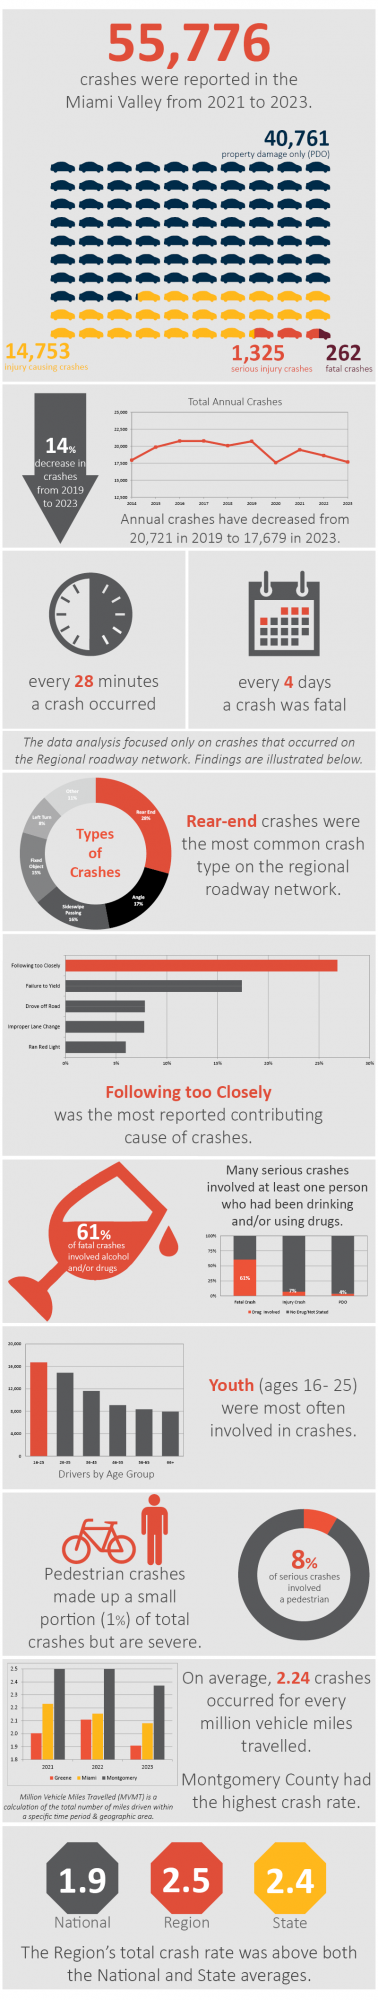
- 55,776 crashes were reported in the Miami Valley from 2021 to 2023.
- 40,761 property damage only (PDO).
- 14,753 injury causing crashes.
- 1,325 serious injury crashes.
- 262 fatal crashes.
- Annual crashes have decreased from 20,721 in 2019 to 17,679 in 2023.
- 14% decrease in crashes from 2019 to 2023.
- Every 28 minutes a crash occurred.
- Every 4 days a crash was fatal.
- The data analysis focused only on crashed that occurred on the Regional roadway network. Findings are presented below.
- Rear-end crashes were the most common crash type on the regional roadway.
- Rear-end: 28%
- Angle: 17%
- Sideswipe Passing 16%
- Fixed Object: 15%
- Left Turn 8%
- Other 11%
- Following too closely was the most reported contributing cause of crashes, followed by Failure to Yield, Drove off Road, Improper Lane Change, and Ran Red Light.
- Many serious crashes involved at least one person who was drinking and/or using drugs.
- 61% of fatal crashes involved alcohol and/or drugs.
- 7% of Injury crashes involved drugs.
- 4% of PDO crashes involved drugs.
- Youth (ages 16-25) were most often involved in crashes.
- Bike or pedestrian crashes made up a small portion (1%) of total crashes but were mostly severe.
- 8% of serious crashes involved a bicycle or pedestrian.
- On average, 2.24 crashes occurred for every million vehicle miles travelled. (Million Vehicle Miles Travelled (MMVT) is a calculation of the total number of miles driven within a specific time period & geographic area.
- Montgomery County had the highest crash rate.
- The Region's total crash rate (2.5) was above both the National (1.9) and State (2.4) averages.